
Summary
From this measurement experiment:
- The farther the distance, the worse the grouping (less accurate the shots).
- Although you can aim a headshot at 50 m, it’s questionable whether you can reliably hit it every time with 100% accuracy.
- The “shooting performance of a person + gun” can be expressed as a quadratic function rather than a simple linear one.
(It’s not just that grouping simply doubles every time distance doubles.)
Measurement Conditions
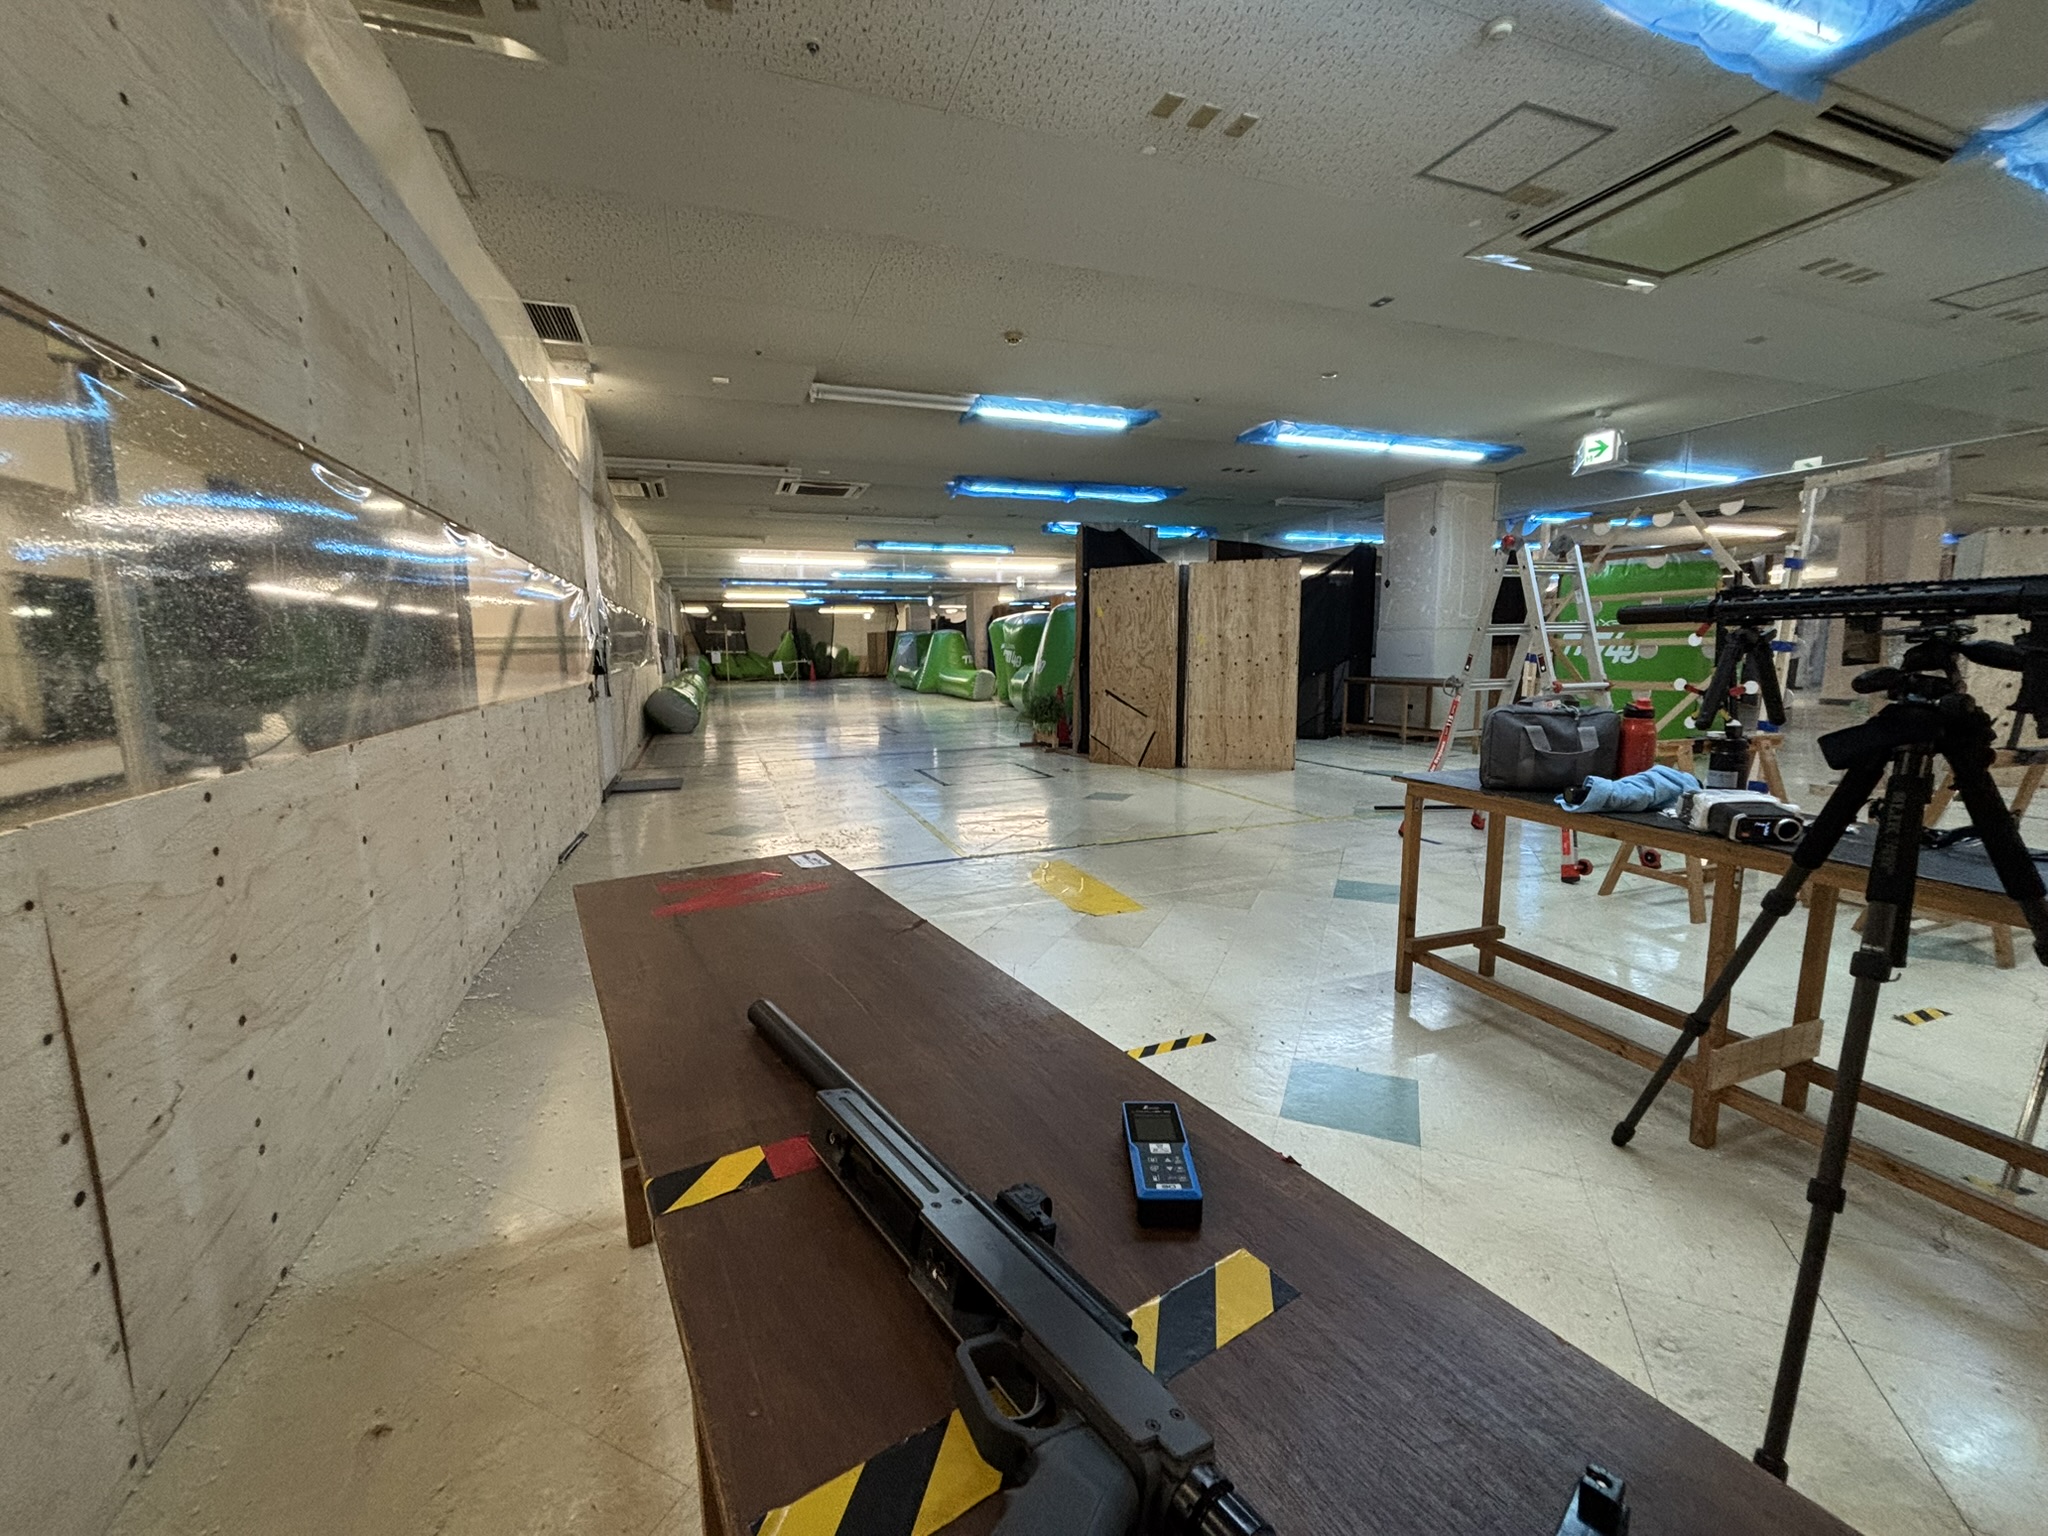
Location: ZEEK
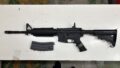
Gun used: Nobita Rifle (VSR-based)
Optics: Trijicon SRO 2.5 MOA
Setup: Table, no sling, support only by elbow.

BBs: HTG U.I. 0.43 g bio BBs
Distances tested: 10 m, 20 m, 30 m
Measurement Method
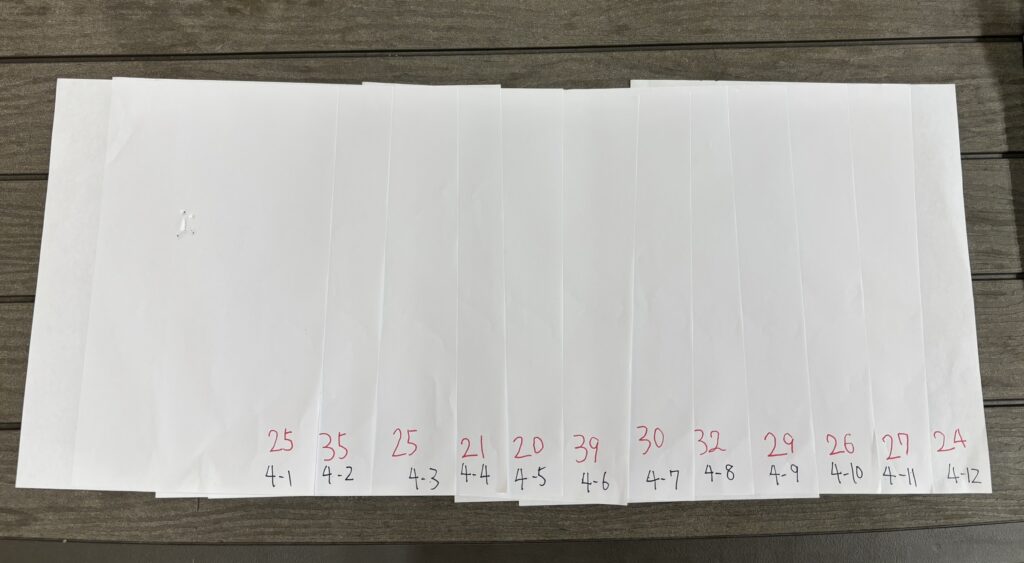
At each distance, shot 12 sets of 10 shots at A3-sized paper targets.
Excluded the single best and worst grouping sets as outliers.
From the remaining 10 sets, median values were calculated to represent final grouping scores.
Results (Grouping Medians)
10m
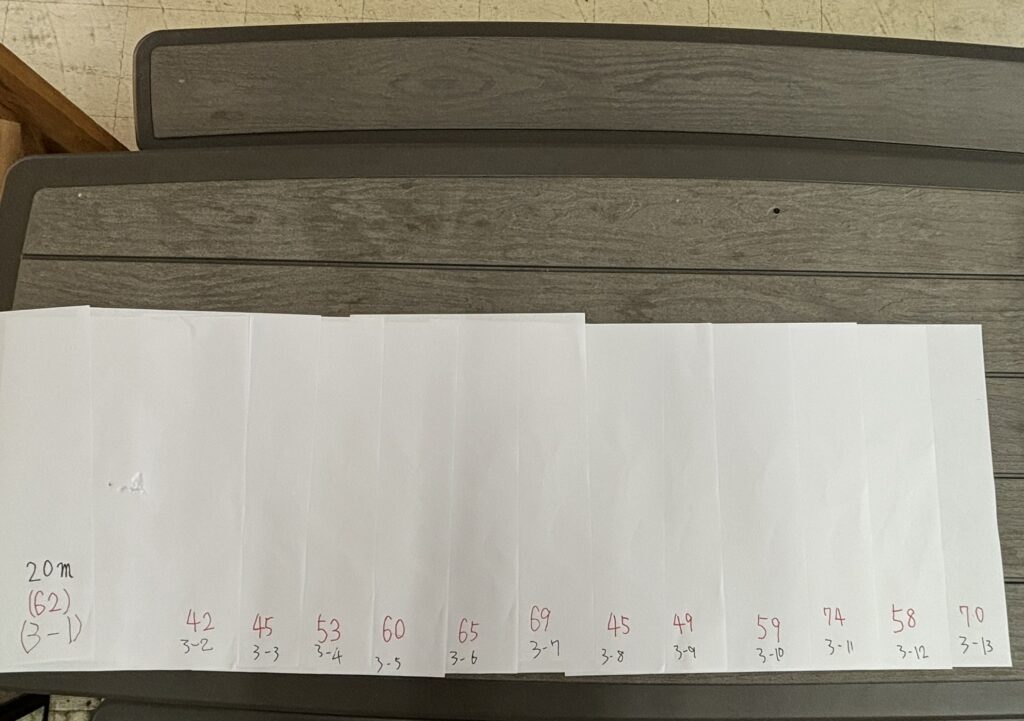
20m
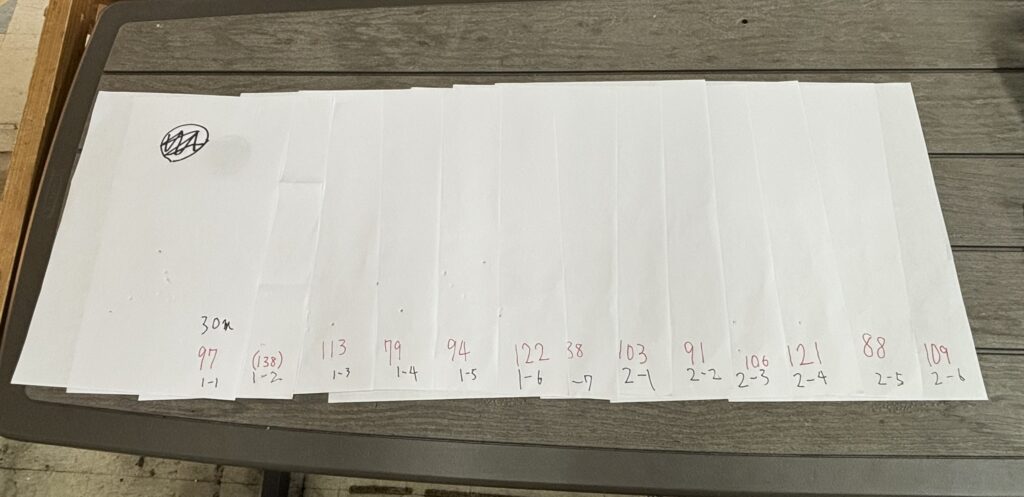
30m
Quadratic Regression Formula
| 10m | 20m | 30m | |
| median | 26.5mm | 58.5mm | 100mm |
Quadratic Regression Formula
A quadratic regression was calculated from the data (excluding first and last 10 shots):
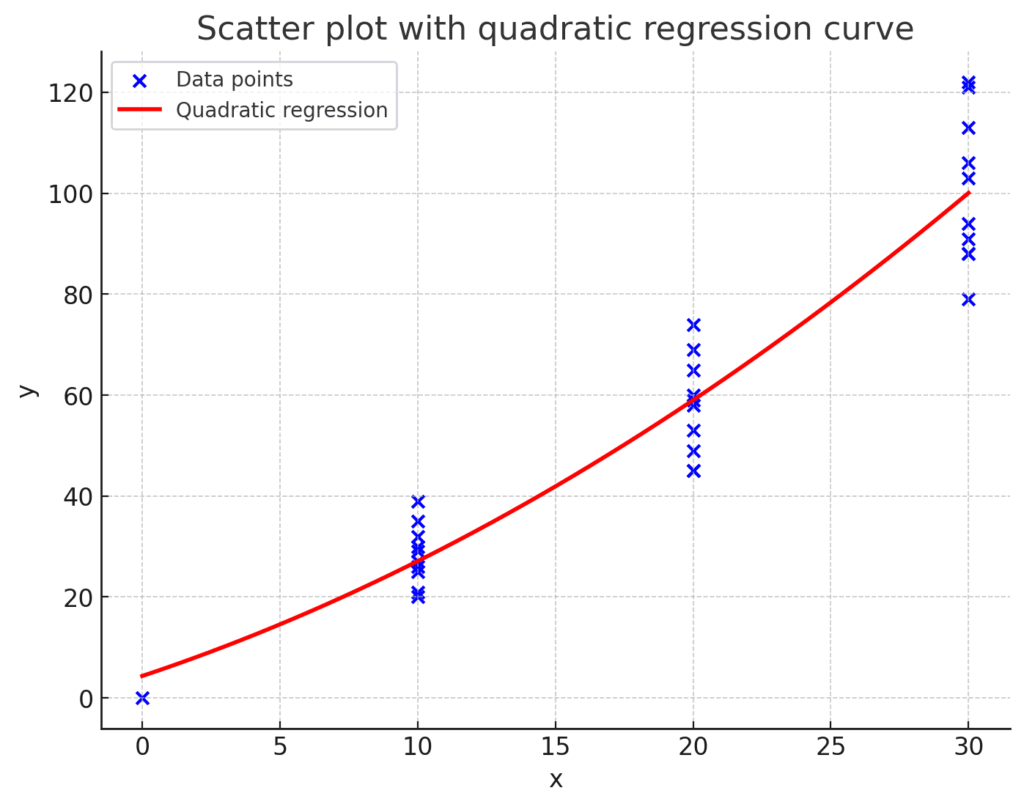
y≈0.0458×2+1.817x+4.345
with R2≈0.903
Using this formula, estimated grouping becomes:
| Distance | 10m | 20m | 30m | 40m | 50m |
| Predicted Grouping | 27mm | 59mm | 100mm | 150mm | 210mm |
| Distance | 60m | 70m | 80m | 90m | 100m |
| Predicted Grouping | 278mm | 356mm | 443mm | 539mm | 644mm |
So grouping increases rapidly with distance, especially past ~30 m.
Conclusion
This experiment allowed the invisible performance of accuracy to be quantified numerically!
By creating a statistical model of grouping vs. distance, you can visualize how hard it gets to keep tight groupings farther away.
(Thanks again to those who pointed out corrections — extremely helpful!)
About the Author
Author: Nobita
Engaged in creative activities using tools like 3D printing (3DP)
I sell my products on BASE.
You can find me on Twitter here.
コメント